
Honey Bee Colony Losses by State and Quarter: USDA Data, 2015 to 2026
Affiliate disclosure: product links on this page go to Amazon, or to the maker's own store for brands that sell only direct. As an Amazon Associate we earn from qualifying purchases, at no extra cost to you; a link to a maker's store earns us nothing. No retailer or brand sees our picks before they are published or has any say in them. How we choose.
US beekeepers with five or more colonies lost 454,890 colonies from January to March 2026, 16% of the colonies they started the year with, and another 321,910 (11%) from April to June. Those are the latest figures from USDA's quarterly Honey Bee Colonies survey, released August 3, 2026. The tracker below puts every quarter since January 2015 in one chart, with the figures for each state USDA publishes, the stressors beekeepers reported, and colonies lost with colony collapse disorder symptoms. Each later report revises the previous year, so we use the newest figure for every quarter. The full state-by-quarter table is free to download as a CSV.
321,910
Colonies lost, Apr-Jun 2026
11% of colonies on Apr 1
454,890
Colonies lost, Jan-Mar 2026
16%, the winter quarter
2.81M
Colonies on Jan 1, 2026
Up 6% on a year earlier
22.2%
Hit by varroa mites, Apr-Jun 2026
The top stressor every quarter since 2015
US honey bee colony losses by quarter, 2015 to 2026
Latest: Apr-Jun 2026, 11%. Revised figures from each later report replace the earlier estimates.
Operations with five or more colonies, from USDA's quarterly Honey Bee Colonies survey. USDA did not collect April to June 2019, so that quarter is missing. National percent lost is colonies lost divided by colonies on the first day of the quarter.
Average share lost, by quarter
- Jan-Mar15.0%
- Apr-Jun11.6%
- Jul-Sep11.9%
- Oct-Dec13.5%
Mean of every quarter USDA reported, 2015 to 2026. Winter (January to March) is the worst quarter.
Colonies lost per year
- 20151,722,360
- 20161,645,560
- 20171,503,910
- 20181,615,150
- 20201,612,510
- 20211,441,690
- 20221,392,840
- 20231,288,310
- 20241,353,350
- 20251,305,540
The four quarters added together, for complete years only (2019 is missing a quarter). Beekeepers replace most losses by splitting colonies and buying packages.
Losses in your state
California, latest quarter published
Apr-Jun 2026: 11% lost
89,000 of 790,000 colonies; average 10.9% across 45 quarters
What affected California colonies in Apr-Jun 2026
- Varroa mites25.2%
- Other pests and parasites3.5%
- Diseases1.3%
- Pesticides8.6%
- Other (weather, starvation, queen failure)3.9%
- Unknown1.2%
Percent of colonies affected at any time in the quarter; a colony can have several stressors.
USDA publishes the larger beekeeping states individually and folds the rest into Other States. From July 2024 it reports 20 states; before that it reported 45. A state's percent lost is colonies lost divided by its maximum colonies in the quarter, which counts hives trucked in for pollination.
States ranked by share lost
- Florida19%
- Georgia17%
- Iowa15%
- North Carolina13%
- California11%
- Mississippi9%
- Washington9%
- Texas8%
- Michigan7%
- Oregon7%
- Louisiana6%
- Minnesota5%
- New York5%
- North Dakota5%
- Ohio5%
- Wisconsin5%
- Idaho4%
- South Dakota4%
- Montana3%
- Pennsylvania2%
Your selected state is highlighted. States USDA did not publish that quarter are left out.
Every quarter, United States
| Quarter | Colonies at start | Lost | Lost % | Added | Varroa % | CCD losses |
|---|---|---|---|---|---|---|
| Apr-Jun 2026 | 2,841,280 | 321,910 | 11% | 619,850 | 22.2% | 58,350 |
| Jan-Mar 2026 | 2,805,370 | 454,890 | 16% | 464,320 | 21.8% | 93,770 |
| Oct-Dec 2025 | 2,954,950 | 347,100 | 12% | 170,560 | 25.4% | 103,070 |
| Jul-Sep 2025 | 3,121,610 | 327,840 | 11% | 182,750 | 22.2% | 72,290 |
| Apr-Jun 2025 | 2,876,810 | 302,100 | 11% | 561,090 | 26.3% | 53,710 |
| Jan-Mar 2025 | 2,639,300 | 328,500 | 12% | 539,200 | 28.3% | 114,680 |
| Oct-Dec 2024 | 2,932,040 | 403,270 | 14% | 128,030 | 29.5% | 133,770 |
| Jul-Sep 2024 | 3,095,610 | 297,340 | 10% | 149,750 | 32.2% | 114,830 |
| Apr-Jun 2024 | 2,819,070 | 257,430 | 9% | 560,550 | 36.6% | 66,650 |
| Jan-Mar 2024 | 2,669,350 | 395,310 | 15% | 520,050 | 31.8% | 70,650 |
| Oct-Dec 2023 | 2,815,960 | 254,520 | 9% | 118,840 | 46.5% | 95,840 |
| Jul-Sep 2023 | 2,923,860 | 281,720 | 10% | 147,310 | 32.5% | 74,570 |
| Apr-Jun 2023 | 2,706,270 | 378,190 | 14% | 618,350 | 52% | 54,530 |
| Jan-Mar 2023 | 2,729,750 | 373,880 | 14% | 324,400 | 39.9% | 107,630 |
| Oct-Dec 2022 | 2,888,130 | 353,910 | 12% | 170,280 | 44.3% | 93,550 |
| Jul-Sep 2022 | 3,107,330 | 343,880 | 11% | 152,640 | 37.3% | 68,620 |
| Apr-Jun 2022 | 2,909,290 | 363,570 | 13% | 573,160 | 47.5% | 51,390 |
| Jan-Mar 2022 | 2,875,670 | 331,480 | 12% | 368,780 | 36% | 86,070 |
| Oct-Dec 2021 | 3,091,790 | 329,110 | 11% | 93,940 | 33.6% | 82,340 |
| Jul-Sep 2021 | 3,173,390 | 295,660 | 9% | 194,900 | 38% | 74,910 |
| Apr-Jun 2021 | 2,829,520 | 352,280 | 12% | 665,730 | 50.7% | 49,420 |
| Jan-Mar 2021 | 2,903,240 | 464,640 | 16% | 417,490 | 33% | 77,150 |
| Oct-Dec 2020 | 3,135,340 | 484,920 | 15% | 271,500 | 48.6% | 116,910 |
| Jul-Sep 2020 | 3,175,330 | 411,490 | 13% | 348,280 | 55.7% | 78,190 |
| Apr-Jun 2020 | 2,972,000 | 300,990 | 10% | 536,170 | 43.1% | 48,270 |
| Jan-Mar 2020 | 2,876,100 | 415,110 | 14% | 511,160 | 25.5% | 105,240 |
| Oct-Dec 2019 | 3,018,110 | 399,510 | 13% | 233,260 | 45.7% | 83,710 |
| Jul-Sep 2019 | 3,175,960 | 434,700 | 14% | 252,550 | 44.1% | 67,240 |
| Jan-Mar 2019 | 2,671,470 | 407,700 | 15% | 247,710 | 45.6% | 59,940 |
| Oct-Dec 2018 | 2,868,970 | 444,730 | 16% | 219,640 | 50.5% | 122,240 |
| Jul-Sep 2018 | 2,958,790 | 377,120 | 13% | 263,560 | 53.8% | 78,270 |
| Apr-Jun 2018 | 2,665,880 | 355,270 | 13% | 676,360 | 56.4% | 49,030 |
| Jan-Mar 2018 | 2,635,220 | 438,030 | 17% | 511,320 | 40.7% | 81,140 |
| Oct-Dec 2017 | 2,849,770 | 424,860 | 15% | 204,510 | 55.3% | 94,750 |
| Jul-Sep 2017 | 2,994,500 | 394,810 | 13% | 284,370 | 45.5% | 49,540 |
| Apr-Jun 2017 | 2,694,150 | 285,590 | 11% | 613,360 | 40.9% | 33,010 |
| Jan-Mar 2017 | 2,641,090 | 398,650 | 15% | 478,240 | 42.2% | 67,830 |
| Oct-Dec 2016 | 3,032,060 | 502,350 | 17% | 124,660 | 46.6% | 129,290 |
| Jul-Sep 2016 | 3,181,180 | 397,290 | 12% | 217,320 | 46.1% | 92,610 |
| Apr-Jun 2016 | 2,801,470 | 329,820 | 12% | 736,920 | 53.4% | 47,780 |
| Jan-Mar 2016 | 2,619,940 | 416,100 | 16% | 571,880 | 34.6% | 115,950 |
| Oct-Dec 2015 | 2,874,760 | 412,380 | 14% | 117,150 | 37% | 87,610 |
| Jul-Sep 2015 | 3,132,880 | 457,100 | 15% | 172,990 | 41.2% | 88,390 |
| Apr-Jun 2015 | 2,849,500 | 352,860 | 12% | 661,860 | 43.4% | 56,760 |
| Jan-Mar 2015 | 2,824,610 | 500,020 | 18% | 546,980 | 25.2% | 92,250 |
Source: USDA NASS Honey Bee Colonies reports, May 2016 to the Aug 3, 2026 release, read Oct 12, 2026. Download the full state-by-quarter table as CSV.
What eleven years of USDA data show
Winter is the expensive quarter. Across every quarter USDA has reported, January to March averages 15.0% of colonies lost, against 11.6% for April to June, 11.9% for July to September and 13.5% for October to December. The worst single quarter in the series was January to March 2015 (18%); the best was July to September 2021 (9%). The most colonies lost in one quarter was 502,350, from October to December 2016.
Losses have eased. Adding the four quarters together, operations with five or more colonies lost about 1.72 million colonies in 2015 and about 1.31 million in 2025. Beekeepers replace most of them: in 2025 they added 1.45 million colonies by splitting hives and buying packages and nucs, which is why the number of colonies on January 1 barely moves. It was 2.82 million in 2015 and 2.81 million in 2026, up 6% on January 1, 2025.
Why this is not the 40% figure in the news
Each June the US Beekeeping Survey, run by Auburn University with Oregon State University and the Apiary Inspectors of America, publishes an annual loss rate. For April 2025 to April 2026 it was 39.9%, down from record years of 55.1% (2023 to 2024) and 55.6% (2024 to 2025). The two surveys measure different things:
| USDA Honey Bee Colonies | US Beekeeping Survey | |
|---|---|---|
| Who answers | A stratified sample of operations with 5 or more colonies | Volunteers: more than 2,300 beekeepers with 219,000 colonies in 2025 to 2026 |
| Period | Each calendar quarter | April to April, split into summer and winter |
| Rate | Colonies lost in the quarter divided by colonies on its first day | Colonies lost divided by all colonies at risk over the year, including ones made or bought |
| Backyard keepers | Operations under 5 colonies are reported separately, if at all | Included; they lost 54.8% in 2025 to 2026 against 38.7% for commercial operations |
Neither is wrong. A beekeeper who loses 16% in winter and smaller shares in the other three quarters can easily lose a third of the colonies they managed across a year, which is what the annual survey captures.
Varroa mites, every quarter
Varroa mites have been the most reported stressor in every quarter since 2015. The share of colonies affected peaked at 56.4% from April to June 2018 and has fallen since: 28.3% in January to March 2025 and 22.2% in April to June 2026. One note for anyone checking our numbers: the summary text of USDA's August 2026 report gives 26.3% for April to June 2026, but its own table gives 22.2%, and 26.3% is the April to June 2025 figure. We use the table. A mite count in spring and late summer is still the single most useful thing a backyard keeper can do.
Colony collapse disorder
USDA counts colonies lost with all four collapse disorder symptoms separately: few dead bees in or around the hive, a rapid loss of adults while the queen, brood and stores remain, delayed robbing, and no varroa or nosema explanation. Operations with five or more colonies reported 93,770 such losses in January to March 2026, down 18% on the 114,680 of a year earlier. Revisions can be large: USDA first put January to March 2025 at 148,410 before revising it to 114,680.
Which states lose the most
State figures use a different base: colonies lost divided by the most colonies in the state during the quarter, which counts hives trucked in for pollination. That makes winter numbers in the northern plains look tiny, because most of their colonies spend January to March in California's almond orchards; Montana reported 10 colonies lost out of 62,000 that winter. In January to March 2026 the highest shares were Pennsylvania (23%), North Carolina and California (18% each) and New York (17%). In April to June 2026 they were Florida (19%), Georgia (17%) and Iowa (15%). Over every quarter since 2015, Georgia averages the highest share (15.2%) and Montana the lowest (5.4%).
USDA reported 45 states individually until April to June 2024 and 20 states since; the rest are in Other States. The tracker shows each state's series for as long as USDA published it.
What it means for a backyard apiary
Plan for losses rather than hoping to avoid them. Starting with two colonies, as the how many hives guide suggests, lets you combine or split when one fails, and the startup cost calculator shows what a replacement package or nuc costs. Order replacements early from the suppliers in our where to buy bees guide; spring packages sell out.
How we built this
We downloaded every Honey Bee Colonies report from May 2016 to August 2026 from USDA NASS and read the colony, stressor and collapse disorder tables for each quarter, 3,814 state rows in all. Every row was checked against the table's own layout in the PDF, and later reports replace earlier estimates for the same quarter. USDA suspended its July 2019 data collection, so April to June 2019 is missing. Dashes in USDA's tables (zero) and "(Z)" entries (less than half a unit) are shown as zero.
Frequently asked questions
How many honey bee colonies were lost in 2025?
Operations with five or more colonies lost about 1.31 million colonies across the four quarters of 2025, according to USDA. They added about 1.45 million by splitting colonies and buying bees, so the number on hand rose.
What percent of bee colonies die each winter?
USDA's January to March quarter has averaged 15% of colonies lost since 2015, and 16% in 2026. The US Beekeeping Survey's October to April winter rate was 30.3% for 2025 to 2026, because it covers six months and counts colonies differently.
Are bee colony losses getting worse?
Not in USDA's quarterly data, where yearly losses fell from about 1.72 million colonies in 2015 to about 1.31 million in 2025. The annual US Beekeeping Survey recorded its two worst years in 2023 to 2025 before falling to 39.9% for 2025 to 2026.
What is the main cause of honey bee colony losses?
Varroa mites are the most reported stressor in every USDA quarter since 2015, affecting 22.2% of colonies from April to June 2026. Beekeepers also report other pests, pesticides, diseases, weather, starvation and queen failure.
Which state loses the most bee colonies?
California loses the most colonies by number because it hosts the largest share of US colonies each winter, mostly for almond pollination: it lost 220,000 of 1.25 million in January to March 2026. By share, Georgia has the highest average since 2015 (15.2% a quarter) and Pennsylvania had the highest share in winter 2026 (23%).
Can I download the data?
Yes. The full table of every quarter for the United States and every state USDA published, with stressors and collapse disorder losses, is linked as a CSV below the tracker.
Sources
- Honey Bee Colonies (August 3, 2026), USDA National Agricultural Statistics Service
- Honey Bee Colonies (May 2016, first report), USDA National Agricultural Statistics Service
- Honey Bee Colonies (August 2020, noting the suspended July 2019 survey), USDA National Agricultural Statistics Service
- 2025-2026 US Beekeeping Survey results, Apiary Inspectors of America
- Honey bee colony losses stabilize following record highs, yet pressures persist, Auburn University
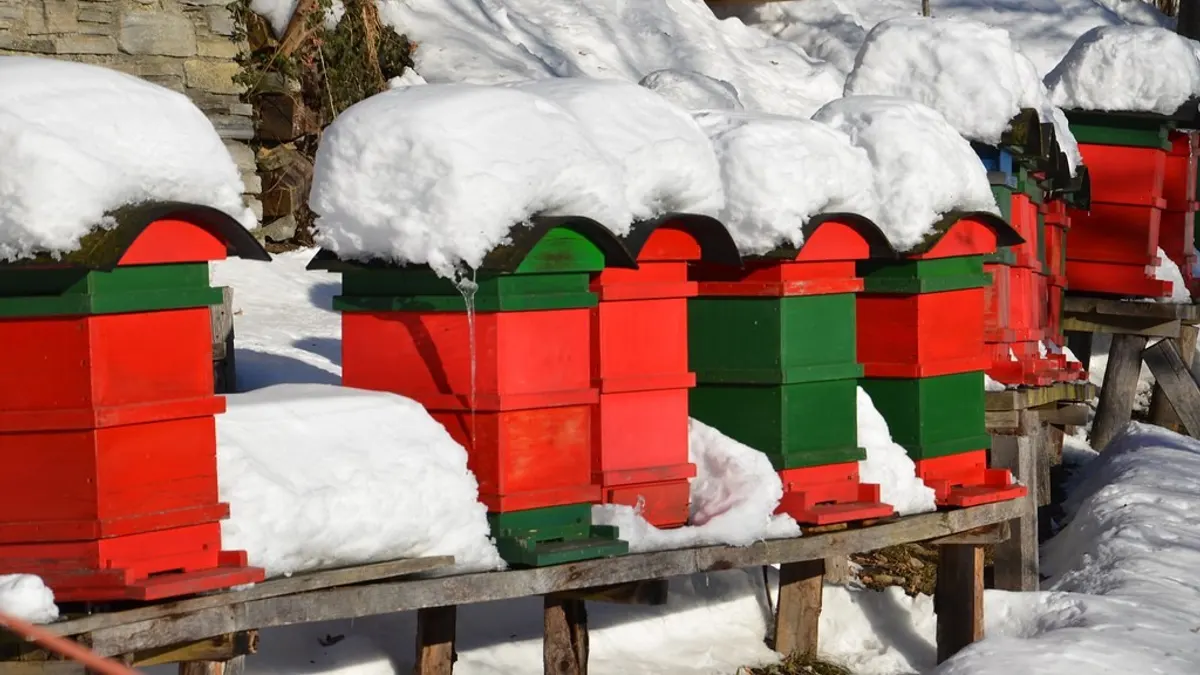
Cover photo: Bienenstoecke im Schnee by margit.winkler, CC0 1.0, via Flickr. Cropped.
Related guides
Do You Have to Register Your Beehives? Rules and Fees in All 50 States
25 states and DC make every beekeeper register, three more above a colony count. Check your state's deadline and fee, with the law linked.
Beekeeping Seasonal Calendar: What to Do Each Season, From the Extension Guides
The year in five seasons from the extension guides: feeding, inspections, mite counts, supers, harvest, winter prep, and the gear for each.
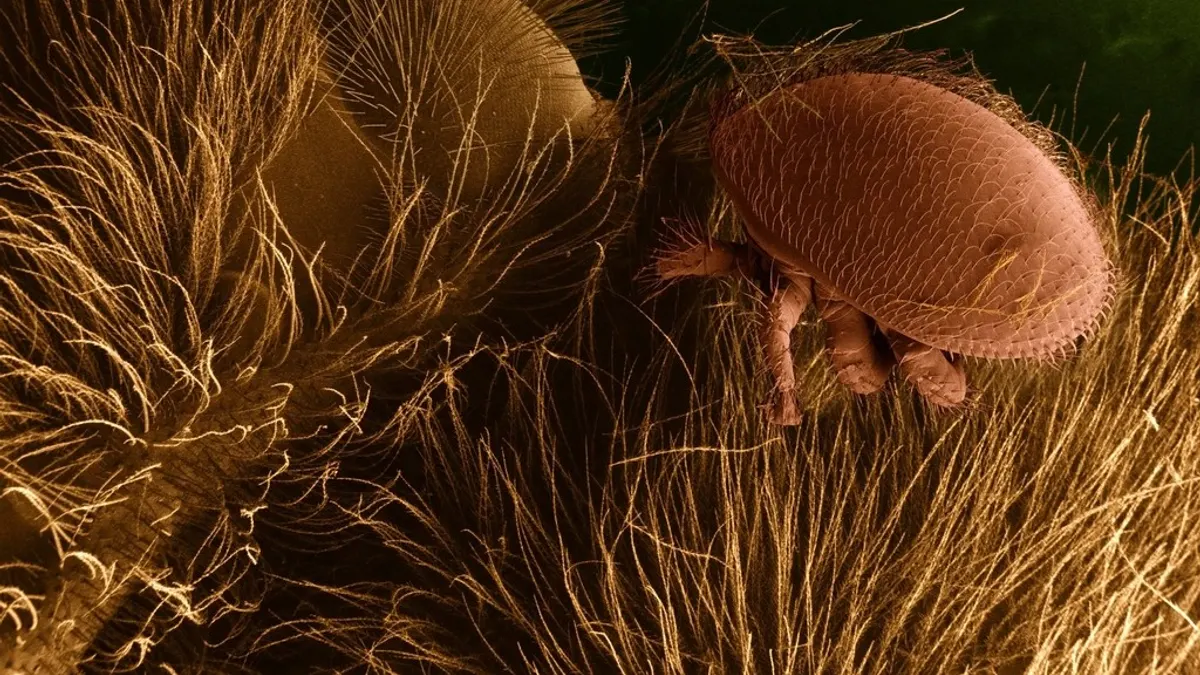
Best Varroa Mite Monitoring Kits and Treatments of 2026: EasyCheck and Labels
Two EasyCheck washers, the HBHC thresholds by season, and four labelled treatments with their timing, temperature and super rules.